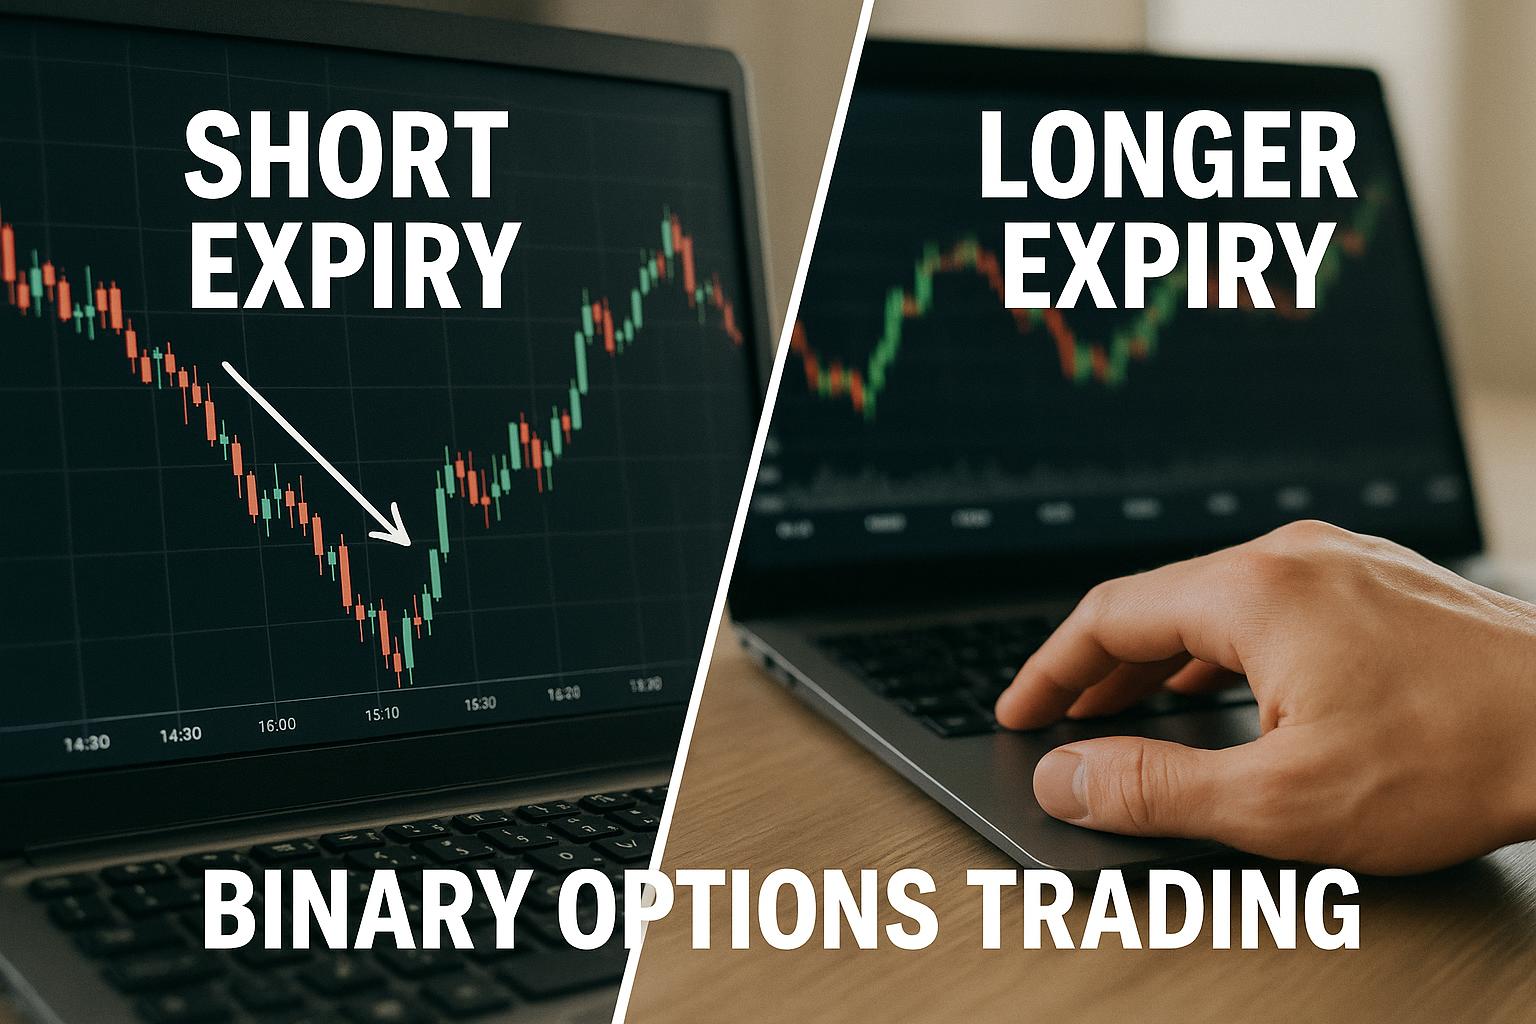
Understanding Binary Options
Binary options trading is a financial instrument that revolves around predicting the future direction of an asset’s price within a predetermined timeframe. The simplicity of binary options makes them attractive to many traders, as they offer a unique trading experience that differs from traditional methods. However, the straightforward nature of binary options does not automatically translate to easy profits. Just like any other form of trading, it requires a solid understanding of the market, strategic planning, and disciplined execution. The core principles and tools for binary options trading are crucial in improving accuracy and enhancing the likelihood of success.
Analyzing Market Trends
A critical element in identifying cleaner binary options setups is to ascertain the ongoing market trends. The ability to read market trends effectively can offer valuable insights into potential future price movements. Trends are classified into three main categories: uptrends, downtrends, and sideways trends, also known as consolidations. By leveraging technical analysis tools, traders can identify these trends and make more informed trading decisions.
Technical analysis is a method of evaluating assets by analyzing statistical data generated by market activities, such as price and volume. Tools such as moving averages and Bollinger Bands play a significant role in spotting trends.
Moving Averages
The use of moving averages is prevalent among traders due to their ability to smooth out price data, which in turn helps in identifying the direction of a trend. The simple moving average (SMA) calculates the average price over a specific number of periods, providing a smoothed line that represents the trend direction. The exponential moving average (EMA), on the other hand, places more weight on recent prices, making it more responsive to new information.
Traders often apply multiple moving averages with different periods to observe short-term and long-term trends. By doing so, they can gain insight into potential trend reversals or continuations, aiding in better entry and exit decisions.
Examining Support and Resistance Levels
Understanding and identifying support and resistance levels is crucial for trading binary options. These levels signify price points where the asset has a history of encountering buying pressure (support) or selling pressure (resistance). Recognizing these levels can offer significant clues about where price movements might stall or reverse.
Support levels are zones where the price tends to stop falling and may reverse, which could provide opportunities for entering call options. Conversely, resistance levels are areas where the price often stops rising and may reverse downward, offering prospects for put options.
Using Price Action
Price action trading is a strategy that relies on past price movements to make decisions. This involves studying candlestick patterns and chart formations that can signal potential reversals or continuations. Notable patterns include the hammer and shooting star, which indicate potential reversals when appearing at specific market levels.
When combined with support and resistance analysis, price action can significantly enhance the accuracy of trade setups, allowing traders to anticipate market behavior with greater precision.
Utilizing Indicators
Employing technical indicators can further refine binary options trading setups. These indicators complement traditional market analysis by providing quantitative measures of market dynamics.
Relative Strength Index (RSI)
The RSI is a momentum oscillator that measures the speed and change of price movements. It oscillates between 0 and 100, with readings above 70 indicating overbought conditions and readings below 30 signaling oversold conditions. By identifying these extremes, traders can better time their entry and exit points.
Stochastic Oscillator
Similar to the RSI, the stochastic oscillator is used to determine overbought or oversold conditions. However, the stochastic oscillator compares an asset’s closing price to its price range over a set period. High readings suggest that the asset may be overbought, while low readings hint at oversold conditions.
These indicators can be powerful tools in a trader’s arsenal, providing crucial signals about potential market turning points and boosting the effectiveness of trade setups when used alongside other analyses.
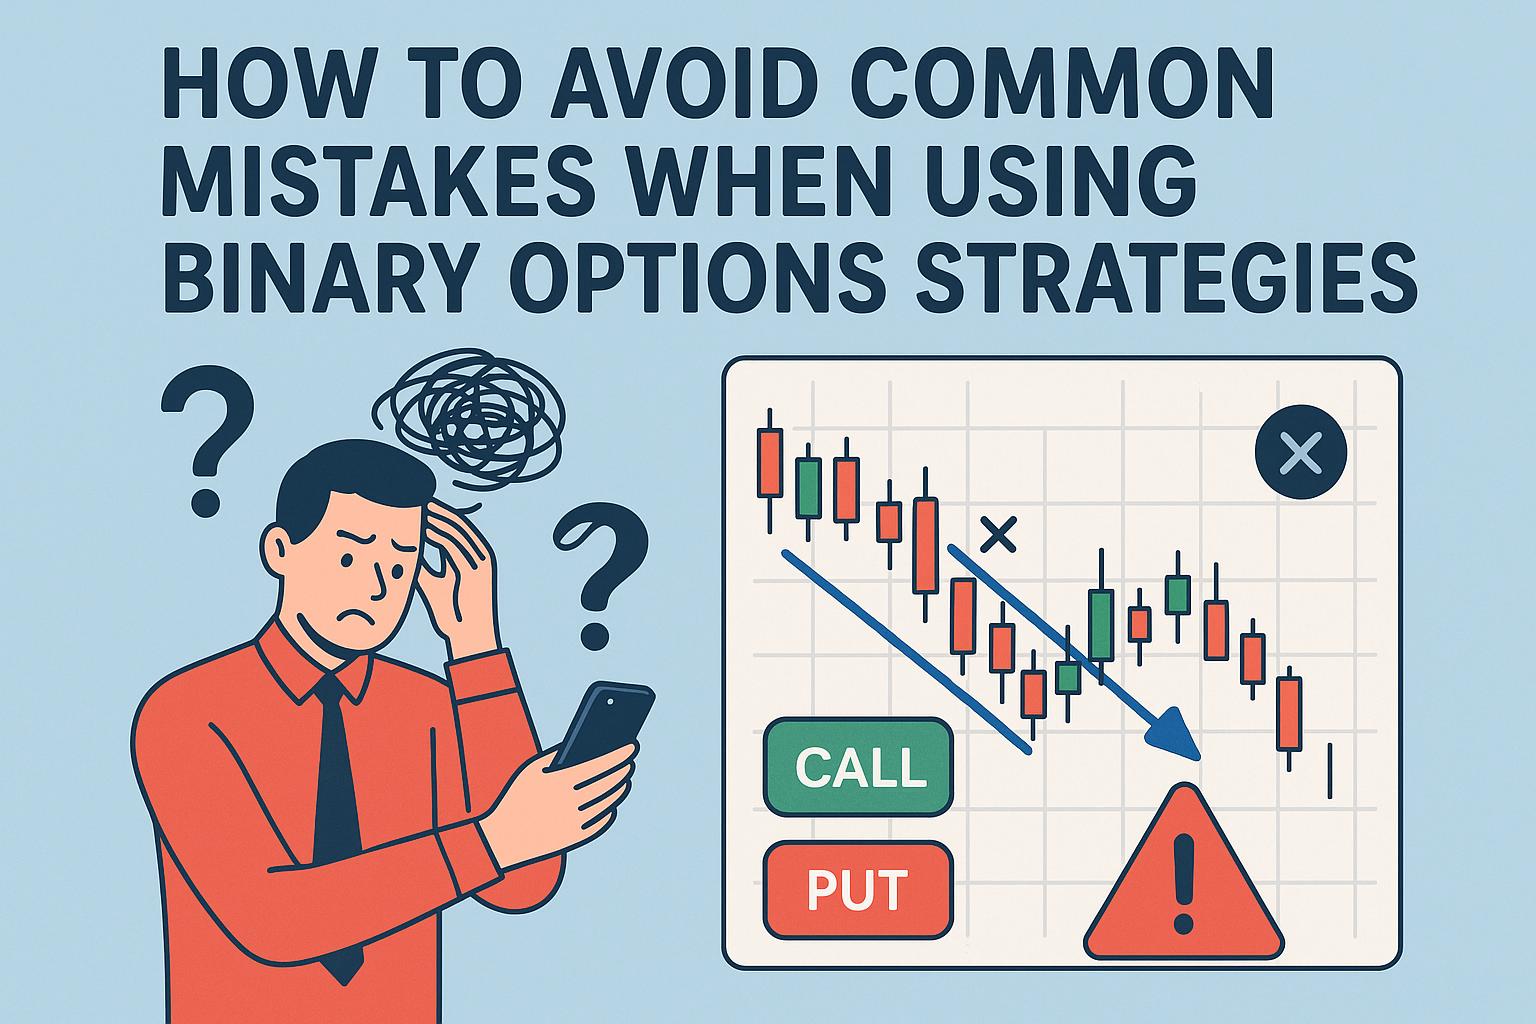
Risk Management Practices
In trading, effective risk management is imperative for sustained success. Implementing sound risk management practices helps mitigate potential losses and enhances the trader’s longevity in the market. A disciplined approach involves setting clear entry and exit points, defining the amount to risk per trade, and sticking to a well-structured trading plan.
By determining the amount to risk, traders can avoid making impulsive decisions influenced by emotions. It is important to remember that trading, including binary options, involves inherent risks, and a well-thought-out risk management strategy is essential for protecting one’s capital.
Conclusion
The process of spotting cleaner binary options setups is a blend of art and science, demanding a disciplined approach that encompasses a thorough analysis of the market, the judicious use of technical indicators, and robust risk management strategies. By focusing on these critical areas, traders can enhance their ability to make well-informed decisions and improve their chances of success in the binary options market.
It is essential for traders to continuously refine their skills and adapt to changing market conditions. Only through diligent practice, learning, and adherence to disciplined trading strategies, can one truly excel in the realm of binary options trading.