Understanding the MACD Indicator
The MACD, or Moving Average Convergence Divergence, stands out as one of the most frequently utilized tools in the realm of technical analysis. Its primary function is to help traders assess the strength, direction, momentum, and duration of a trend within the price of a stock. Crafted using two exponential moving averages (EMAs), it provides insights valuable for anyone participating in trading, particularly in binary options. As traders seek to make informed decisions, having a thorough understanding of the MACD becomes indispensable.
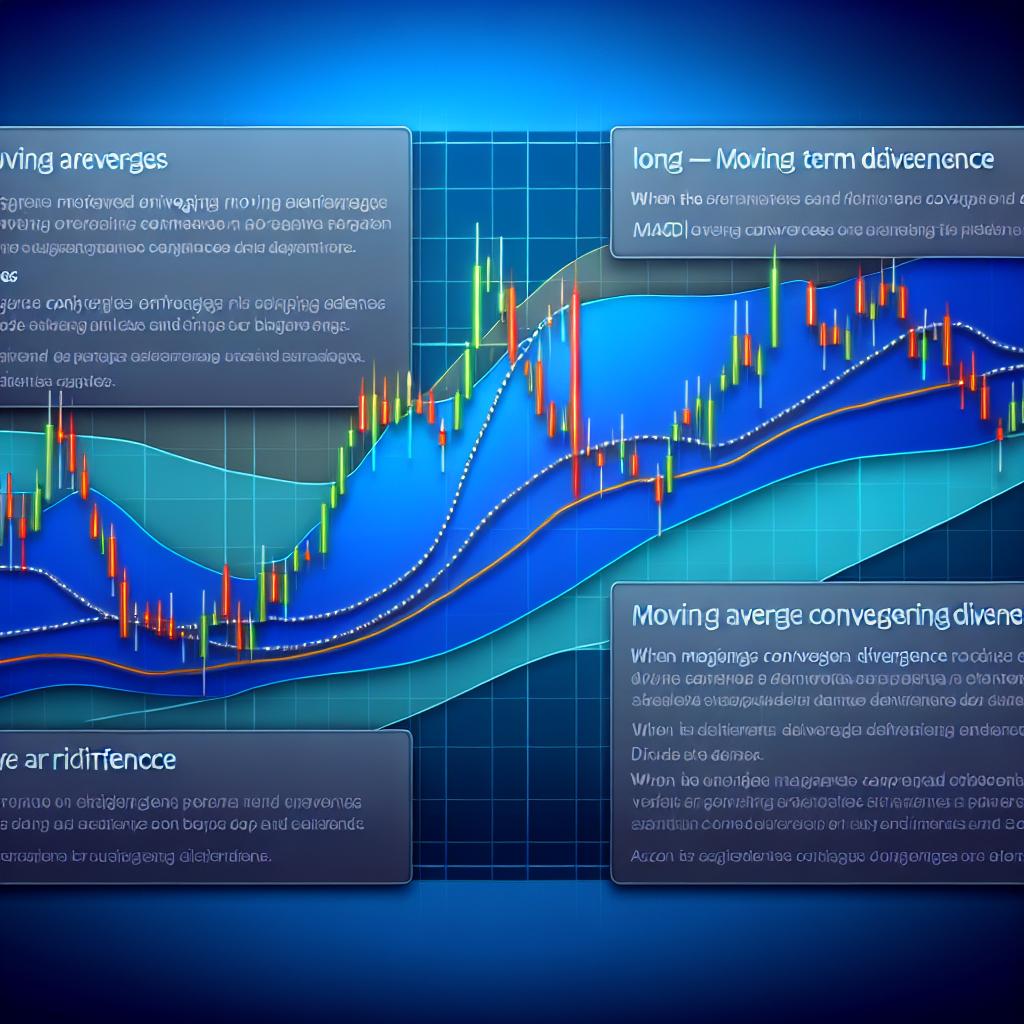
Components of the MACD
The MACD indicator is constructed from three distinct components, each offering its unique perspective on market trends:
MACD Line: This fundamental line is the result of calculating the difference between the 12-day and 26-day EMAs. This line plays a pivotal role, as its fluctuations provide traders with potential buy or sell signals, suggesting opportune moments to enter or exit positions.
Signal Line: Representing a 9-day EMA of the MACD line, the signal line’s primary function is to smooth out abrupt movements in the market. It acts as a secondary reference, allowing traders to differentiate between normal market noise and significant trend shifts.
Histogram: The histogram visualizes the difference between the MACD line and the signal line. By offering a graphical depiction of their relationship, the histogram helps traders gauge the momentum and clearer dynamics of price changes. This component is crucial as it allows a clearer visualization of market conditions and potential trends.
How the MACD Works
At its core, the MACD aims to capture momentum shifts in pricing, potentially indicating upcoming trend transformations. When the MACD line crosses above the signal line, this often serves as a bullish indicator, suggesting that it might be an opportune time to buy. Conversely, when the MACD line crosses below the signal line, it might hint at a bearish trend, signaling traders to consider selling. The histogram complements this by visually representing the intensity of these movements, allowing traders to assess the potential sustainability of current trends accurately.
Applying MACD Strategy in Binary Options
Binary options trading emphasizes accurate prediction of price movements within set time frames, making precise timing crucial. The MACD is a suitable tool for refining these predictions and enhancing decision-making precision.
Trading Signals for Binary Options
When employing the MACD in binary options trading, traders primarily focus on three distinct signals:
Crossovers: As noted earlier, when the MACD line crosses over the signal line, it signifies potential entry or exit points. In the context of binary options, this crossover can dictate whether a trader should place a ‘call’ or ‘put’ option, depending on the direction of the crossover.
Divergence: Divergence takes place when there is a discrepancy between the direction of the asset’s price and the MACD’s indication. Such divergence often points to a potential market reversal. For instance, a bullish divergence, where the price decreases while the MACD rises, might suggest a ‘call’ opportunity. Conversely, a bearish divergence, where the price increases yet the MACD declines, could signal a ‘put’ opportunity.
Overbought/Oversold Conditions: While the MACD isn’t traditionally employed to signal overbought or oversold conditions, extreme readings can be indicative of such scenarios. They may offer insights into market momentum and hint at possible trend reversals, providing valuable context for traders.
Advantages of Using the MACD for Binary Options
The MACD is appreciated for several reasons. Its straightforward nature makes it accessible to both novice traders beginning their journey and seasoned traders who require a reliable tool for market analysis. By integrating dual EMA strategies and offering visual insights through histograms, the MACD presents a well-rounded perspective on market dynamics, allowing traders to more accurately predict and respond to price movements.
Limitations to Consider
Despite its strengths, the MACD is not without limitations. Its signals can at times be misleading, especially in market conditions that are characterized by stagnation or sideways movement. In such situations, where little momentum exists, false signals may arise. To mitigate these risks, it is prudent for traders to employ the MACD in tandem with other analytical tools or indicators, ensuring corroborated signals and fostering more reliable decision-making.
Resources for Further Learning
For those keen on delving deeper into the MACD indicator, various online platforms offer a wealth of resources. These can include detailed tutorials that break down the intricacies of the MACD, webinars presented by market experts, and even practice trading accounts that allow users to test and refine their strategies without risk. When seeking these resources, prioritize trustworthy platforms that offer accurate, unbiased information coupled with robust analytical tools, as these will be instrumental in honing trading skills.
Incorporating the MACD into a broader analysis toolkit is a strategic move for traders who wish to effectively navigate the binary options market. By leveraging the insights offered by the MACD, alongside other analytical instruments, traders stand poised to make more informed and potentially successful trades. The MACD, when used judiciously, can significantly enhance a trader’s ability to anticipate market shifts and respond proactively, ultimately contributing to more astute trading practices.
This article was last updated on: June 8, 2025